

Synopsis: Trent Ltd has formed a head-and-shoulders pattern on its 30-minute chart, signaling a potential bearish reversal.
After a steady uptrend over recent sessions, Trent Ltd has formed a head-and-shoulders pattern on the 30-minute chart, signaling a potential bearish reversal. The head-and-shoulders pattern is a classic bearish reversal formation, defined by a higher central peak (the head) flanked by two lower peaks (the shoulders). This configuration signals a potential shift from bullish to bearish momentum once the neckline is decisively breached.
On Thursday, Trent Ltd formed a lower high at the right shoulder of the head-and-shoulders pattern and decisively broke below the Rs 4,130 neckline. This breakdown, accompanied by slightly subdued buying volumes, confirms the onset of near-term bearish momentum.
The downside target is projected by measuring the head-to-neckline distance and extending it downward from the breakdown point, often aligning with immediate support levels. Traders use this level to set profit targets and manage positions.
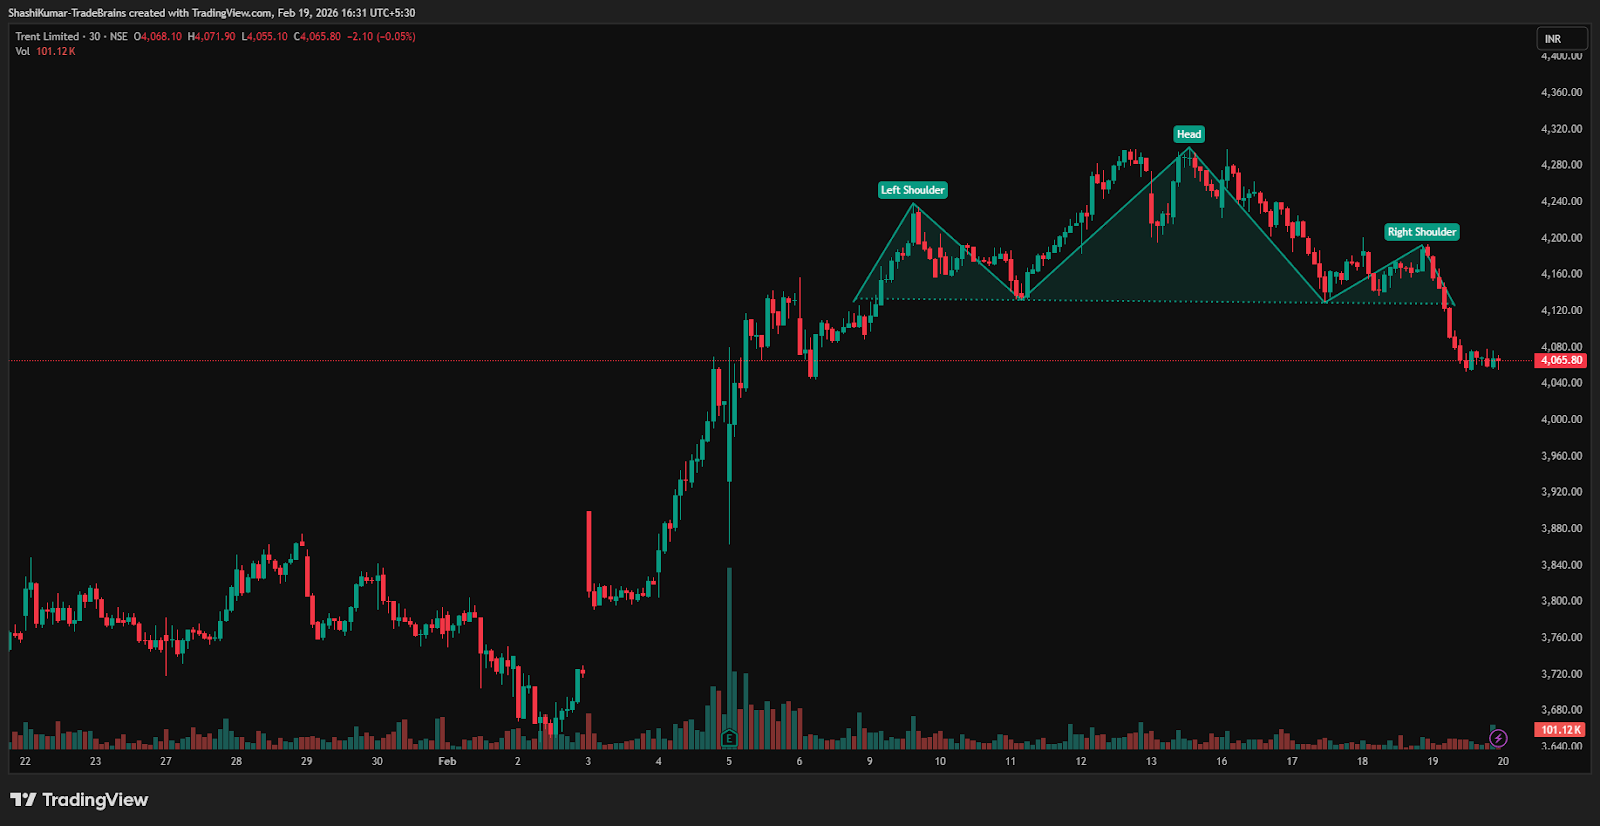
Trent Ltd Chart: 30-min Timeframe
Indicator Confirmation
- RSI: The daily RSI shows persistent bearish momentum, as it dropped from 58 in the last trading session to 49.5 on Thursday, confirming the continuation of the downtrend.
- Price Volume Trend: The Price Volume Indicator confirms the down trend, supported by a sharp increase in selling volume.
Implications
The head-and-shoulders breakdown suggests further downside, with Rs 4,130 as immediate resistance. A decisive close below the neckline on higher volume would confirm bearish control.
About the stock
Trent Limited, part of the Tata Group, runs Westside (with 18,000–34,000 sq. ft in 90 cities), Zudio (7,000–10,000 sq. ft.), and Trent Hypermarket. Westside offers fashion, home, and beauty products, Zudio provides value fashion for all ages, and Samoh focuses on occasion wear and accessories, delivering wide variety, international shopping experience, and affordable pricing.
Over the past month, Trent Ltd gained 3.15% amid a sustained uptrend. However, the stock has declined 25.95% over the past six months and down 18.46% over the last year.
Disclaimer: The views and investment tips expressed by investment experts/broking houses/rating agencies on tradebrains.in are their own, and not that of the website or its management. Investing in equities poses a risk of financial losses. Investors must therefore exercise due caution while investing or trading in stocks. Trade Brains Technologies Private Limited or the author are not liable for any losses caused as a result of the decision based on this article. Please consult your investment advisor before investing.
For more such technical stock ideas, Click here to view our research page.


