

Synopsis: PB Fintech Ltd has formed a symmetrical triangle pattern on the 30-minute chart, indicating a potential breakout scenario in the near term.
A symmetrical triangle forms as price consolidates between converging highs and lows. A breakout above the upper trendline, ideally on higher volume, signals a potential bullish move.
From the above chart, the symmetrical triangle pattern has already seen a breakout above the neckline, and the price is currently trading above it. This confirms the bullish move and suggests that upward momentum may continue in the near term.
On Thursday, PB Fintech Ltd continued to trade above the neckline of the symmetrical triangle pattern on the 30-minute chart, maintaining the bullish bias. A sustained move above the Rs 1,545 level could support further upside, while a drop below this level may weaken the outlook.
For a symmetrical triangle, targets can be set at immediate resistance levels or by projecting the triangle’s height from the breakout point. Traders watch volume and momentum for confirmation and may trail profits as the price moves in the breakout direction.
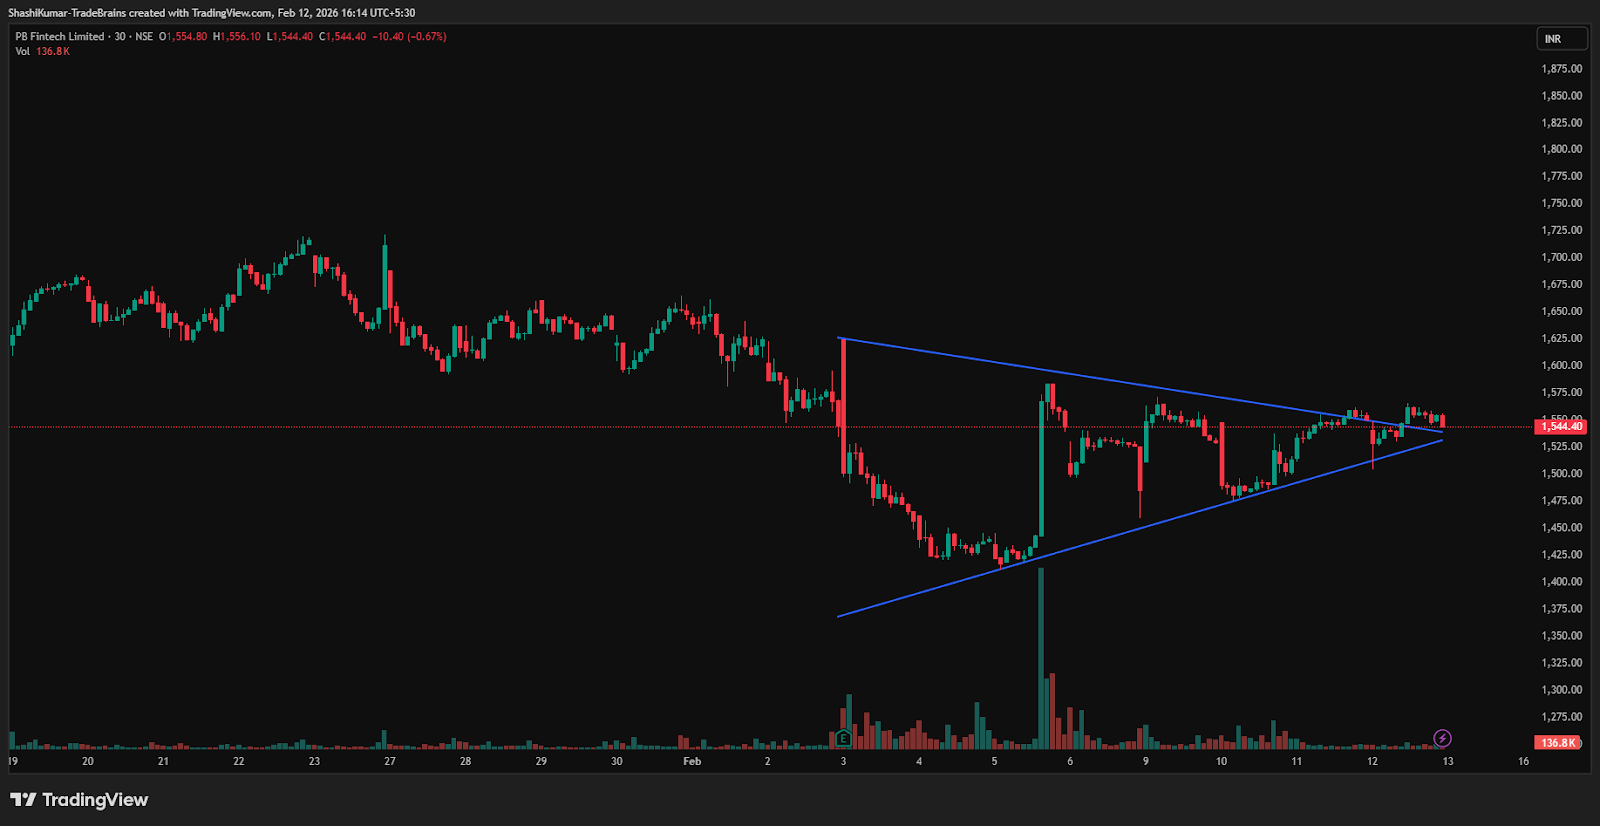
PB Fintech Ltd Chart: 30-minute Timeframe
Indicator Confirmation
MACD: On the daily time frame, the blue MACD line crossed above the orange signal line, with the histogram turning green, indicating bullish momentum.
Implications
The symmetrical triangle pattern indicates potential upside. Holding above Rs 1,545 support, supported by strong volumes, would reinforce near-term bullish momentum.
About the stock
PB Fintech Limited is the parent company of India’s leading online marketplaces, Policybazaar and Paisabazaar. It provides end-to-end insurance and credit solutions aimed at helping the middle class secure financial protection and access credit. The company leverages technology and data to simplify financial decisions through personalized products In the past month, PB Fintech Ltd has dropped 7.82%. Over the previous six months, the stock has fallen 15.5%, and it is still 3.04% lower than it was a year ago.
Disclaimer: The views and investment tips expressed by investment experts/broking houses/rating agencies on tradebrains.in are their own, and not that of the website or its management. Investing in equities poses a risk of financial losses. Investors must therefore exercise due caution while investing or trading in stocks. Trade Brains Technologies Private Limited or the author are not liable for any losses caused as a result of the decision based on this article. Please consult your investment advisor before investing.
For more such technical stock ideas, click here to view our research page.


