

Synopsis: HFCL Ltd has formed a double-bottom pattern on the 4-hour chart, signalling a potential near-term bullish reversal.
The formation of a double-bottom pattern following a prolonged decline highlights strong buying interest at lower levels. A decisive breakout above the neckline signals the potential for a bullish trend reversal.
The double-bottom pattern suggests a potential trend reversal after a prior decline, marked by two similar lows around a key support area. A clear breakout above the neckline indicates strengthening buying interest, signalling waning seller control and the potential for upside momentum to build.
On Friday, HFCL Ltd formed a double-bottom pattern on the 4-hour chart, showing early signs of a potential reversal. A decisive break above the neckline, supported by stronger buying interest, would confirm the near-term bullish trend and reinforce upside potential.
In a double-bottom pattern, upside targets are usually set at resistance levels above the neckline. Traders often use these zones for partial or full profit booking while closely watching price action for signs of trend continuation or potential exhaustion.
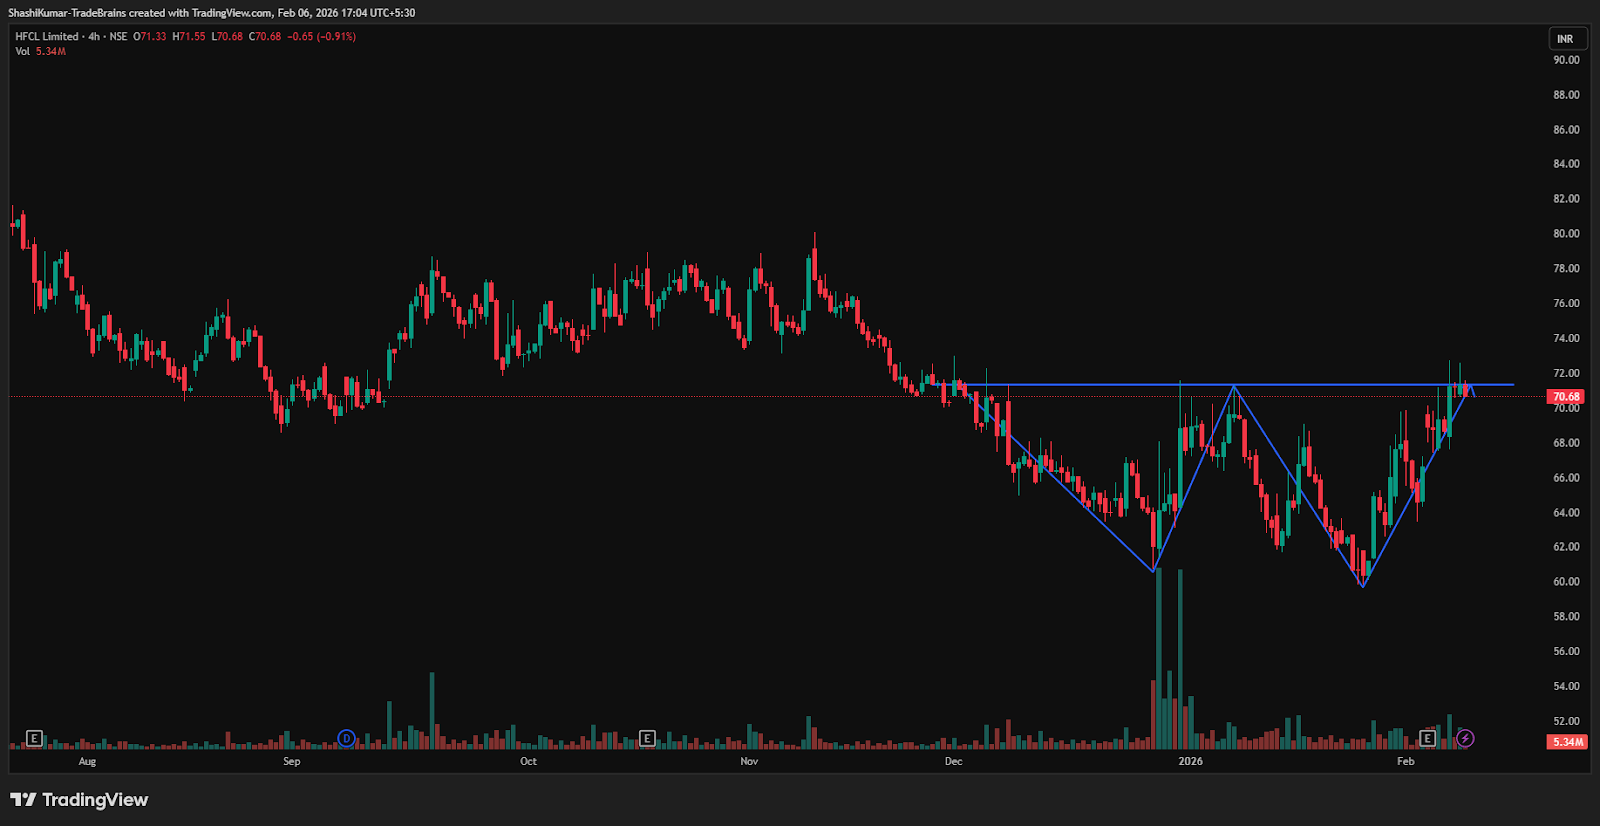
HFCL Ltd Chart: 4-hour Timeframe
Indicator Confirmation
MACD: On the 4-hour time frame, the blue MACD line crossed above the orange signal line, with the histogram turning green, indicating bullish momentum.
Moving Averages: On the 4-hour time frame, the 5-day moving average has crossed above the 9-day moving average, further confirming a bullish trend.
Implications
The emergence of a double-bottom pattern indicates potential upside. A sustained close above the key Rs 71.3 level, supported by higher volumes, would confirm the reversal and lower the risk of a false breakout. With the earlier resistance around Rs 71.3 now acting as immediate support, maintaining levels above this zone would reinforce near-term bullish momentum.
About the stock
HFCL is a leading technology company specialising in telecom, defence equipment, optical fiber, and digital network solutions. Backed by strong in-house R&D and global system integration expertise, it delivers advanced products such as 5G RAN and transport solutions, Wi-Fi systems, routers, and defence electronics. HFCL operates multiple manufacturing facilities across India and serves customers globally across telecom, enterprise, and government sectors.
Over the past month, HFCL Ltd has risen by 1.74%. However, the stock has slipped 2.99% over the last six months and remains down 29.31% on a year-on-year basis.
Disclaimer: The views and investment tips expressed by investment experts/broking houses/rating agencies on tradebrains.in are their own, and not that of the website or its management. Investing in equities poses a risk of financial losses. Investors must therefore exercise due caution while investing or trading in stocks. Trade Brains Technologies Private Limited or the author are not liable for any losses caused as a result of the decision based on this article. Please consult your investment advisor before investing. For more such technical stock ideas, clickhereto view our research page.


