

Synopsis: Navin Fluorine International Ltd has formed an Inverted Head & Shoulders pattern on the 30-min chart, suggesting a potential near-term bullish reversal
The inverted head & shoulders pattern signals weakening selling pressure and rising buying interest, indicating a bullish reversal.

The inverted head and shoulders pattern has three troughs, with the middle one being the lowest (head) and the two sides being higher (shoulders). A breakout above the neckline signals a potential bullish reversal.
On Tuesday, Navin Fluorine International Ltd. broke the neckline of an inverted head-and-shoulders pattern on the 30-min chart. A sustained move above the Rs 6,234 level could drive further upside, while a drop below this level may weaken the bullish outlook.
For an inverted head and shoulders pattern, targets are set at immediate resistance or by projecting the head-to-neckline distance upward. Traders trail profits while watching volume and momentum for confirmation.
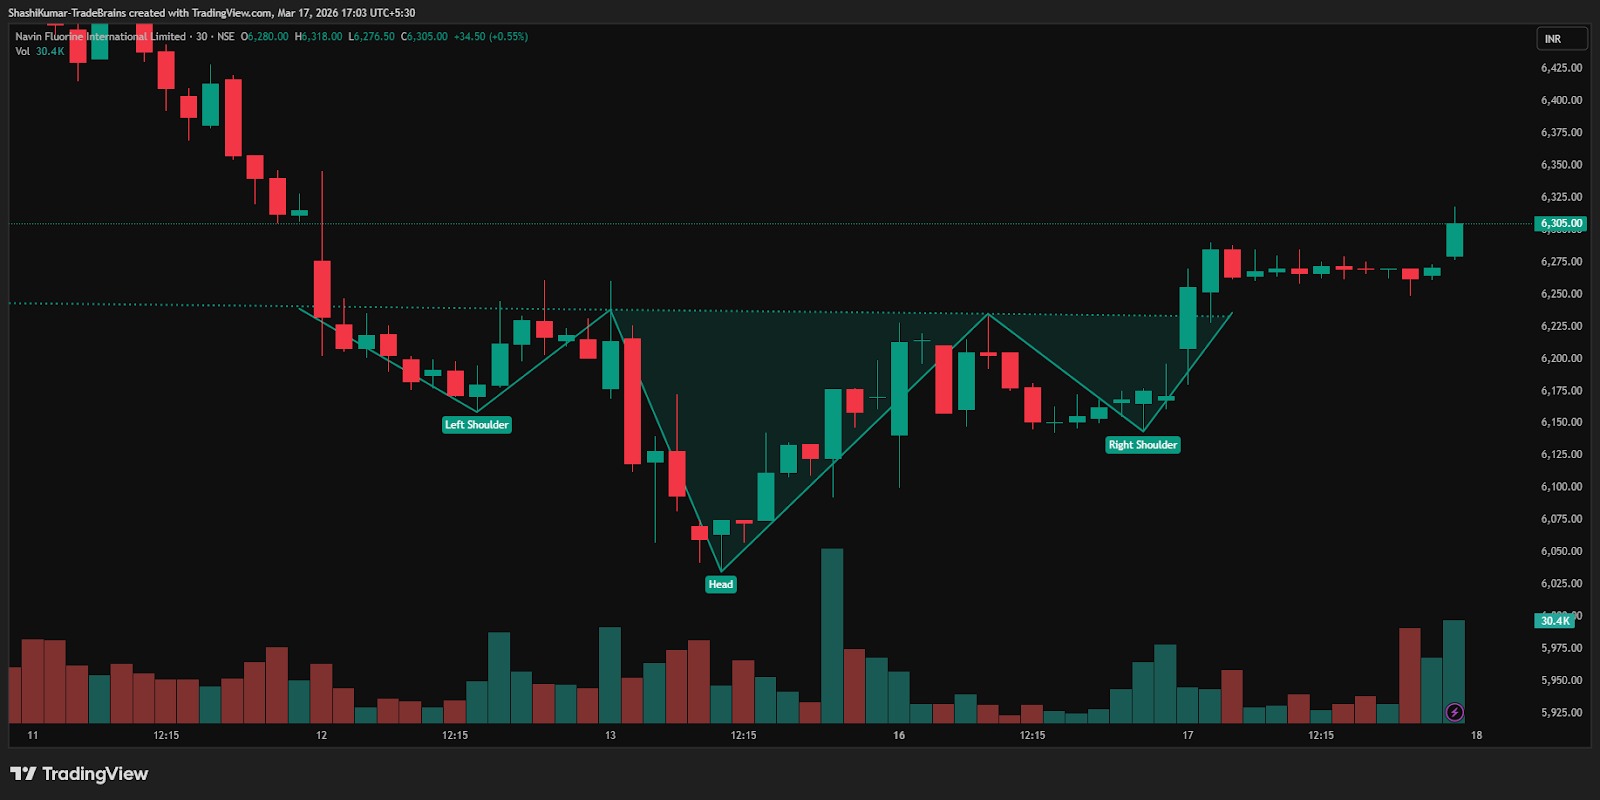
Navin Fluorine International Ltd Chart: 30-min Timeframe
Indicator Confirmation
- RSI: The daily RSI indicates bullish momentum, as it rose from 46.30 in the previous trading session to 49.52 on Tuesday, confirming the bullish reversal.
- Price Volume Trend: The Price Volume Indicator confirms the uptrend, accompanied by a slight increase in buying volume in the daily time frame.
Implications
The inverted head & shoulders pattern indicates potential upside. Holding above Rs 6,234 support, backed by strong volumes, would reinforce near-term bullish momentum.
About the stock
Navin Fluorine International Ltd is primary engaged in producing refrigeration gases, inorganic fluorides, specialty organofluorines and offers contract research and manufacturing services. It has total 900+ customers, 3 R&D centres and four factories.
Over the past month, Navin Fluorine International Ltd has gained 1.02%. Over the last six months, the stock has surged 26.89% and a 51.93% gain on a year-over-year basis. For more such technical stock ideas, clickhereto view our research page.
Disclaimer: The views and investment tips expressed by investment experts/broking houses/rating agencies on tradebrains.in are their own, and not that of the website or its management. Investing in equities poses a risk of financial losses. Investors must therefore exercise due caution while investing or trading in stocks. Trade Brains Technologies Private Limited or the author are not liable for any losses caused as a result of the decision based on this article. Please consult your investment advisor before investing.


