

Synopsis: Kaynes Technology India Ltd has formed a descending triangle pattern on the 1-hour chart and has broken out on the upside, indicating a potential bullish continuation in the near term.
The Descending Triangle pattern shows sellers repeatedly testing support, but an upside breakout indicates buyers have absorbed supply and gained control, signalling potential bullish momentum.
The Descending Triangle pattern consists of a horizontal support level and a downward-sloping resistance line. A breakout above the resistance trendline indicates a possible bullish reversal or continuation move.
On Wednesday, Kaynes Technology India Ltd broke above the resistance trendline of a descending triangle pattern on the 1-hour chart. Following the breakout above Rs 3,960, the stock witnessed strong buying interest. A sustained move above Rs 3,960 could lead to further upside, while a fall back below this level may weaken the bullish momentum.
For a descending triangle pattern, targets are placed at nearby resistance or by adding the triangle’s height above the breakout point. Traders trail profits and monitor volume and momentum for confirmation.
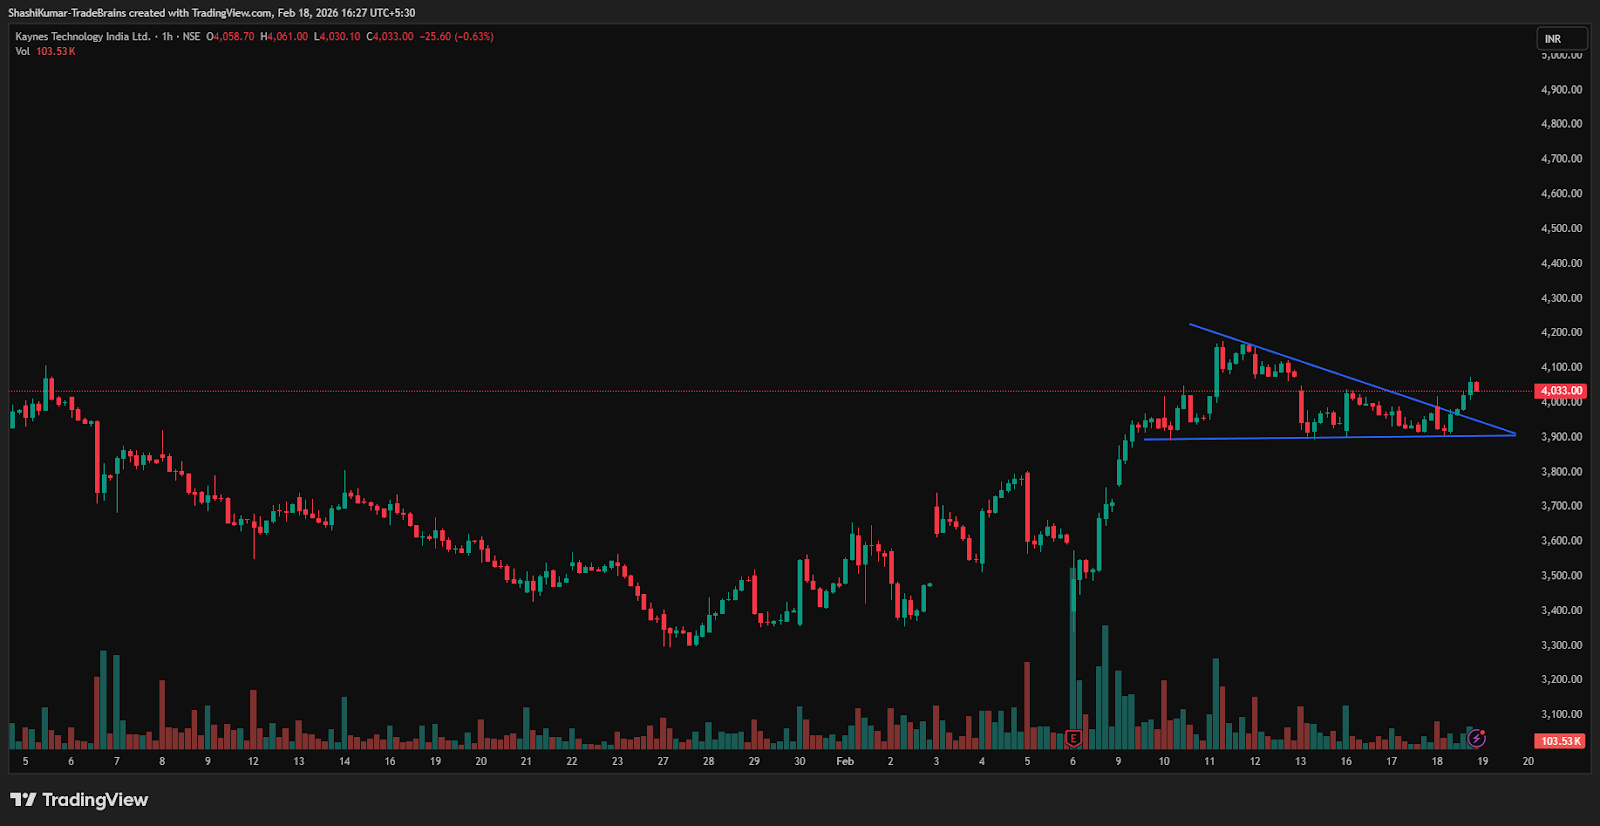
Kaynes Technology India Ltd Chart: 1-hour Timeframe
Indicator Confirmation
- RSI: The daily RSI indicates bullish momentum, as it rose from 54.3 in the previous trading session to 57.9 on Wednesday, confirming the bullish reversal.
- MACD: On the daily time frame, the blue MACD line was above the orange signal line, with the histogram turning green, indicating bullish momentum.
- Moving Averages: On the daily time frame, the 5-day moving average has crossed above the 9-day moving average, further confirming a bullish trend.
- Price Volume Trend: The Price Volume Indicator confirms the uptrend, accompanied by an increase in buying volume in the daily time frame.
Implications
The descending triangle pattern signals potential upside after the breakout. Sustaining above Rs 3,960 support, backed by strong volumes, would strengthen near-term bullish momentum in Kaynes Technology India Ltd.
About the stock
Kaynes Technology India Ltd is a leading end-to-end, IoT-enabled electronics manufacturer in India with over three decades of experience in electronics system design and manufacturing services. It offers design, engineering, manufacturing, and lifecycle support across automotive, EV, aerospace, defence, medical, railway, and IT sectors, supported by 16 advanced manufacturing facilities and dedicated service centres.
Over the past month, Kaynes Technology India Ltd has gained 12.01%. However, despite this recent recovery, the stock is down 35.74% over the last six months, while still posting a modest 2.11% gain on a year-on-year basis. For more such technical stock ideas, click here to view our research page.
Disclaimer: The views and investment tips expressed by investment experts/broking houses/rating agencies on tradebrains.in are their own, and not that of the website or its management. Investing in equities poses a risk of financial losses. Investors must therefore exercise due caution while investing or trading in stocks. Trade Brains Technologies Private Limited or the author are not liable for any losses caused as a result of the decision based on this article. Please consult your investment advisor before investing.


