

Synopsis: Choice International Ltd has developed a symmetrical triangle on the 30-minute chart, signaling a potential near-term bullish breakout.
A symmetrical triangle forms when price consolidates within converging highs and lows. A breakout above the upper trendline, preferably on increased volume, indicates a potential bullish move.
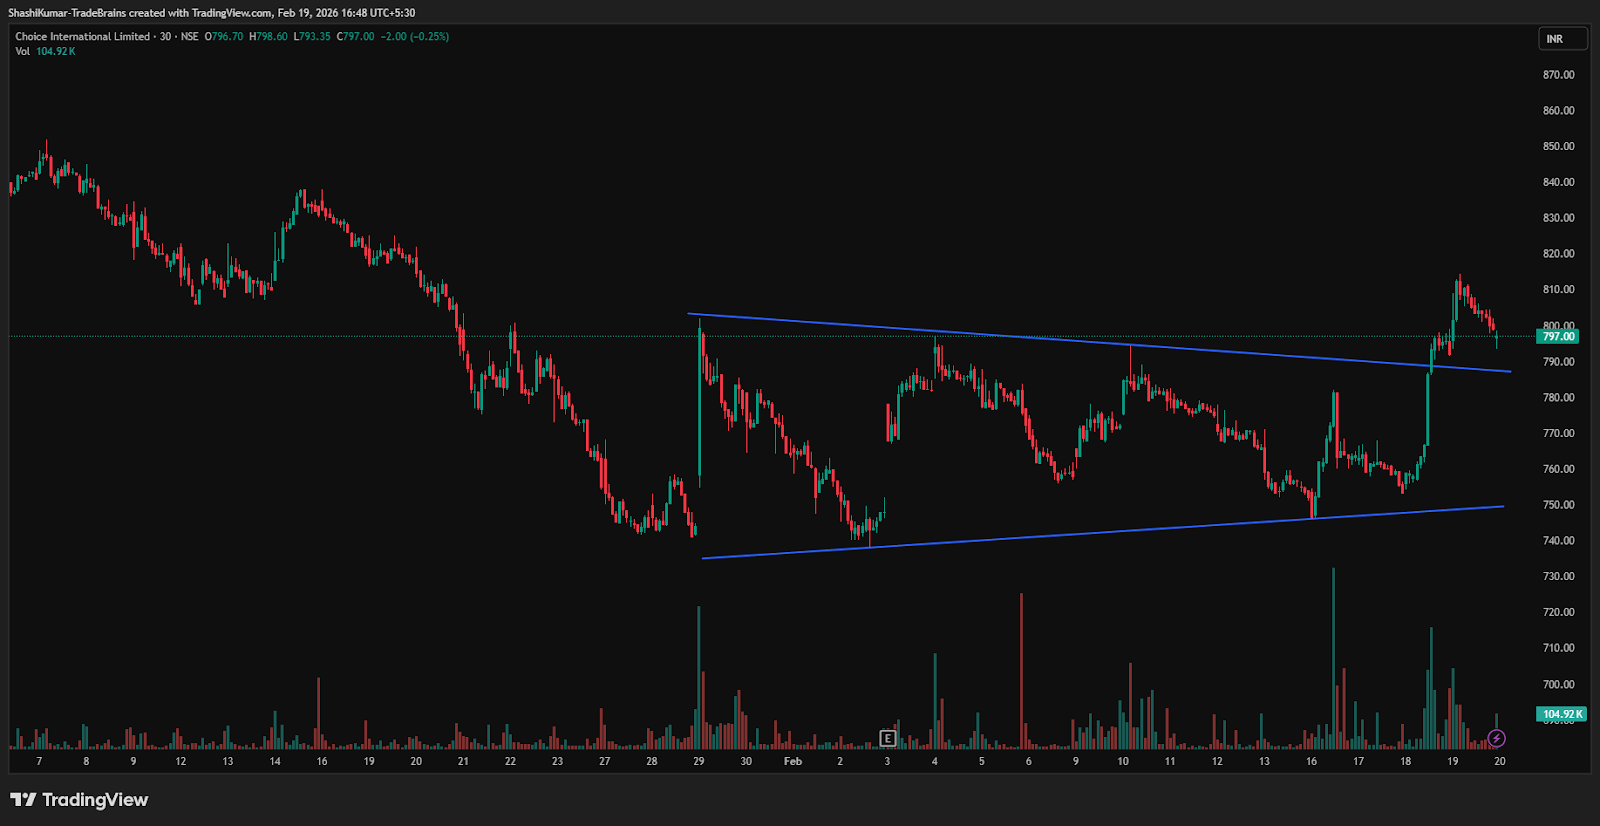
The chart shows that the symmetrical triangle has broken above the neckline, with price now trading higher. This confirms the bullish breakout and indicates that upward momentum may continue in the near term.
On Thursday, Choice International Ltd remained above the symmetrical triangle’s neckline on the 30-minute chart, sustaining its bullish bias. A decisive move above Rs 788 level could drive further gains, while a drop below this level may signal a weakening outlook.
For a symmetrical triangle, targets are set either at immediate resistance levels or by projecting the triangle’s height from the breakout point. Traders monitor volume and momentum for confirmation and often trail profits as the price moves in the breakout direction.
Choice International Ltd Chart: 30-minute Timeframe
Indicator Confirmation
RSI: The daily RSI shows a bullish momentum, as it rose from 55 in the last trading session to 55.7 on Thursday, confirming the continuation of the up trend.
Moving Averages: On the daily time frame, the 5-day moving average was above the 9-day moving average, further confirming a bullish trend.
MACD: On the daily time frame, the blue MACD line was above the orange signal line, with the histogram turning green, indicating bullish momentum.
Implications
The symmetrical triangle pattern signals potential upside, with holding above Rs 788 on strong volume likely to reinforce near-term bullish momentum.
About the stock
Headquartered in Mumbai, Choice Group is a decade-old financial services firm offering diversified finance, engineering, and consulting solutions. Registered with SEBI, RBI, NSE, BSE, MCX, NCDEX, AMFI, and depositories CDSL & NSDL, it has grown into a top-20 broker in India, serving 15+ lakh clients through 65,000+ trained business associates, leveraging innovative technologies and end-to-end financial solutions.
Over the past month, Choice International Ltd has declined 2.62%, with a six-month drop of 2.7%. However, the stock remains up 61.89% compared to its level a year ago. For more such technical stock ideas, click here to view our research page.
Disclaimer: The views and investment tips expressed by investment experts/broking houses/rating agencies on tradebrains.in are their own, and not that of the website or its management. Investing in equities poses a risk of financial losses. Investors must therefore exercise due caution while investing or trading in stocks. Trade Brains Technologies Private Limited or the author are not liable for any losses caused as a result of the decision based on this article. Please consult your investment advisor before investing.


